Introduction
DuckDB is rapidly becoming a favorite tool for data analysts, engineers, and scientists. Why? Because it’s fast, lightweight, and incredibly easy to use, especially for analytical workloads. But what exactly is DuckDB, and how can you leverage it effectively?
What Is DuckDB?
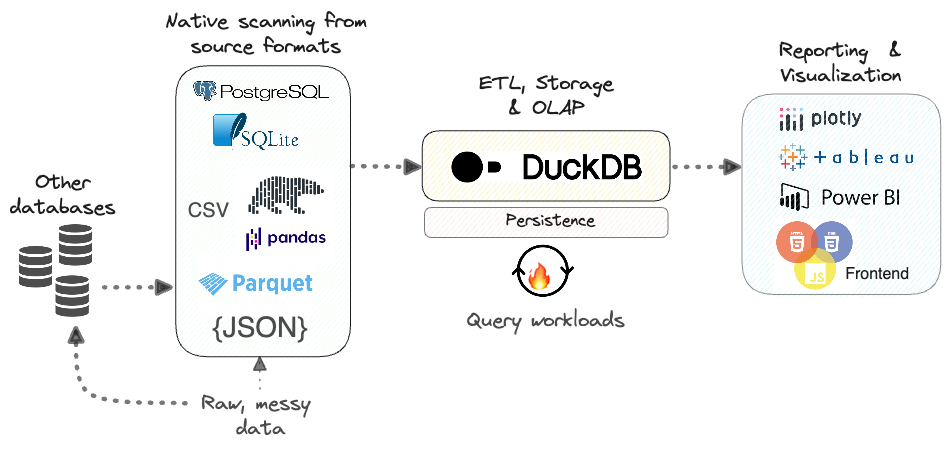
It is a fast, easy-to-use database for data analysis. Additionally, unlike big systems like PostgreSQL, it runs right inside your app; no server is needed. It’s like SQLite but built for analytics, not transactions.
Why Use DuckDB?
- Firstly, Lightweight – No setup, install, and go.
- Secondly, Super Fast – Perfect for big data queries.
- Thirdly, Works Everywhere – Use it in Python, R, or even from the command line.
- Then, Free Forever – No hidden costs.
Getting Started with DuckDB
Installation Made Easy
Firstly, want to try it? Here’s how to install it in seconds.
If you want to read about interior designing with AI, Click Here
For Python Users
Then, run this command:
bash
Copy
pip install duckdb
Then, you’re ready to go!
For Everyone Else
Furthermore, download it CLI from their website. Then, it works on Windows, Mac, and Linux.
Your First DuckDB Queries
Let’s load some data and run simple queries.
1. Loading a CSV File
Then, Python
Copy
import duckdb
conn = duckdb.connect()
conn.execute("CREATE TABLE sales AS SELECT * FROM read_csv('sales.csv')")
2. Running a Basic Query
Furthermore, find total sales by region:
python
Copy
results = conn.execute("""
    SELECT region, SUM(revenue) as total_sales
    FROM sales
    GROUP BY region
""").fetchdf()
3. Saving Your Results
Then, Export data to a Parquet file:
python
Copy
conn.execute("COPY (SELECT * FROM sales) TO 'results.parquet' (FORMAT PARQUET)")
Cool Tricks with DuckDB
1. Time-Series Analysis
Additionally, Group data by day:
sql
Then, Copy
SELECT
    DATE_TRUNC('day', timestamp) as day,
    SUM(sales) as daily_total
FROM transactions
GROUP BY day
2. Geospatial Queries (With Extensions)
Firstly, enable the spatial extension:
sql
Then, Copy
INSTALL spatial;
LOAD spatial;
Then find nearby locations:
sql
Then, Copy
SELECT * FROM places
WHERE ST_Distance(location, ST_Point(-73.985, 40.748)) < 1000
3. Machine Learning Inside SQL
Moreover, train a simple model directly in it:
Then, SQL
Then, Copy
CREATE TABLE predictions AS
SELECT
    linear_reg(sales, ad_spend) OVER () as model
FROM marketing_data
DuckDB vs. Other Databases
| Feature | DuckDB | SQLite | PostgreSQL |
|---|---|---|---|
| Use Case | OLAP | OLTP | Mixed |
| Serverless | ✅ Yes | ✅ Yes | ❌ No |
| Speed | ⚡ Fast | 🐢 Slow | 🚀 Fast |
| Analytics | ★★★★★ | ★★☆☆☆ | ★★★★☆ |
When to Use it?
Pick it if:
✔ Firstly, you need fast analytics.
✔ Secondly, you hate setting up servers.
Then, you work with Python or R.
Tips for Best Performance
- Firstly, use Parquet files – they load faster than CSV.
- Secondly, avoid tiny files – merge them for better speed.
- Then, let it handle optimizations – It’s easy on its own!
When to Use it?
- Firstly, for analytics on local/embedded systems.
- Secondly, when you need fast queries without a database server.
- Thirdly, for ETL pipelines with Python/R.
Final Thoughts
Moreover, it is perfect for quick data analysis without the hassle. Whether you’re a data scientist, developer, or analyst, it makes your life easier.
Next Steps
🔹 Firstly, try it with your datasets.
🔹Secondly, explore extensions (JSON, spatial, ML).
Then, join the community on GitHub.
Now that you know how to use it, what will you analyze first? 🚀
Ready to try it? Download it today and start querying in minutes!